I’d like to begin my blogging adventure by writing about Desmos. Desmos is a wonderfully dynamic website where one can explore graphs of various functions. It makes “compare and contrast” activities engaging because students have the ability to manipulate different functions in real time, and understand how they relate to one another.
Recently, I had students use Desmos on their iPads to discover how the various components of the equation of a circle relate to its corresponding graph.
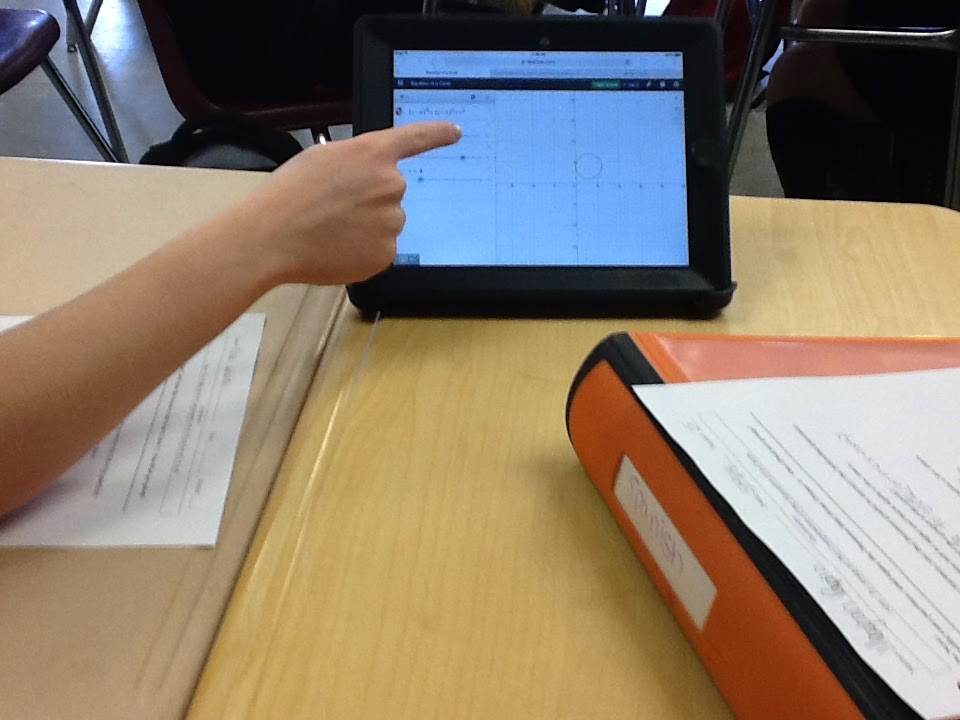
Students were able to visually see the graphs change as they used sliders to change the components of the equation. An engaging class discussion led us to declare that the equation of a circle is simply a demonstration of the distance formula (distance from the center to a point on the circumference), which in turn is simply a demonstration of the Pythagorean Theorem!
I love when my students are able to make cross-unit connections between the material. Understanding where the material comes from alleviates their usual overwhelming feelings of: “OMG! I have to memorize so many formulas!” Moving away from the idea of memorizing formulas by engaging in more “reasoning and sense-making” discussions helps students synthesize the material on a deeper level.
Visit the Desmos website here or download the iOS app or Google Play app. Feel free to utilize the Desmos graph I made by clicking here. Happy graphing!
